A New Approach to Relative Value Analysis
When people hear “Relative Value Analysis” for equities, they usually think of Price/Earnings ratios and other such comparison metrics. The traditional market based valuation models involve short listing companies in a sector and coming up with Price or Enterprise Value multiples for them. Is this really practical in today’s diverse markets?
Is Amazon a software company or a retailer? How do you compare Apple and Microsoft? What about high fliers like Tesla and Netflix - are they tech companies too? In some cases companies break down their performance by business segments to allow for a sum of the parts analysis but even then it is practically impossible to find pure play comparables. Is there a better way to gauge relative value? We think so.
The Clustering Algorithm
Imagine for a minute if investors in the market were only given the business fundamentals of companies and asked to value them. Every investor would be given information about Gross Margins, Operating Margins, Revenue Growth, Return on Invested Capital (ROIC) etc but not the name of the company or the sector/industry it belongs to. How do you think investors would value the companies?
In a truly efficient market, shouldn't investors base their investment decisions on the actual business fundamentals and performance of the companies? The idea behind clustering is to try to find true comparables for companies we want to evaluate. When people traditionally do Relative Value Analysis, they find comparables in the same industry or roughly targeting the same customer base. However this does not take into account the actual fundamentals of the business and how much the current market is paying for those qualities (For example, top line growth or leverage in the business model etc). We are attempting to address this in our clustering algorithm.
We start by looking at the fundamentals of the business for each company irrespective of their industry. Suppose we pick N fundamental features (For example: Gross Margin, Operating Margin, Return on Invested Capital, Rev Growth etc) of the business, this gives us a point in an N-dimensional feature space for every company.
The next challenge is to find comparables which are closest to the target company in terms of their fundamental financial metrics. This is where Machine Learning comes in handy. Humans are typically very bad at comparing more than 2-3 features - not much of a problem for our algorithms. We run an algorithm on this N-dimensional feature space to identify the cohort of companies with the most similar business fundamentals to our target company.
Consider the cohort of companies displayed below for Apple at one point in time. Notice how all the companies exhibit a healthy ROA, ROE, ROIC and Gross/Operating margins but have minimal revenue growth and typically a slightly declining Net Income? This represents the cohort of companies that were, at the time, closest to Apple in terms of their business fundamentals.
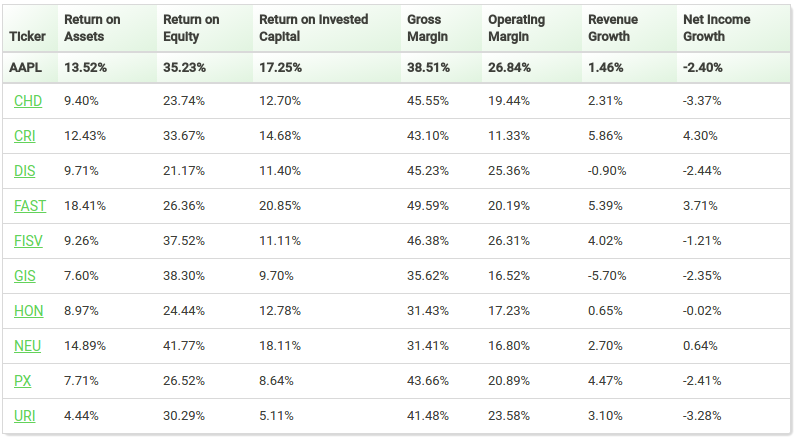
Now you may very well find some feature for a company in the cohort that does not look too similar to the target company. However this company made it into the cohort because its other features are much closer to our target. The key takeaway here is that our clustering is trying to find the the companies most similar to our target company across all dimensions in our N-dimension feature space. Any discrepancy you see in clustering in a lower dimensional space is just a result of us ignoring the input from the additional features.
While the details of the full set of features we use and how we define the feature space are proprietary, all the features shown in the table above are included and all features share some common characteristics:
- The features chosen represent fundamental features that represent the health and performance of the target company's business.
- The features chosen do NOT include any valuation metrics. At this point we are only concerned with the quality of the underlying business irrespective of valuations or industry.
- The features for a company only change when the company reports quarterly/annual results and in general are chosen to not be too volatile over subsequent reporting periods to keep the churn in the cohorts to a minimum.
The Relative Value Model
At the end of the clustering process we have cohorts of companies based on the fundamental characteristics of their business. This forms the foundation for our Relative Value model. Every cohort may have some unique characteristics. For example, a stable and profitable business will have a cohort of similar stable/profitable companies. A company with operational losses but substantial revenue growth may have a cohort of companies with those characteristics and so on. Based on the individual characteristics of each cohort, we pick an appropriate Relative Value Model for it. To give users a sense of the characteristics of a cohort, we also generate some standard “Fair Value” Valuation metrics for the cluster such as P/E, P/S, P/FCF, EV/EBITDA.
Based on these fair value metrics, we produce a target “Cohort Fair Value” for each security along with a range of values representing a more conservative to a more aggressive valuation approach. This value represents a "Fair Value" if investors only looked at the fundamentals of the business. However we also know that investors have built in biases some of which is not expected to erode over any reasonable timeframe. To account for this, we look at the discount/premium that companies in a given sector are trading to our cohort fair value and apply this adjustment to our model. Why do this? And why just at a high level sector and not at a more granular industry level? Remember we are trying to generate alpha by identifying mispricing in the market between business fundamentals and market valuations of companies. What we are attempting to capture with this adjustment is for example premiums market pays for tech companies, discount the market takes on cyclical companies at the top of the cycle etc. If the current market price of a security is significantly lower or higher than our "Fair Value", we label it "Relatively Undervalued" and "Relatively Overvalued" respectively.
Interpreting the Model Output
So how do you incorporate our model in your analysis? The most important point to remember is that this is a Relative Value Model. We are not looking at valuations of the target security in isolation based on first principles; nor are we looking at any macro-economic factors that can expand or contract valuations in the future. A “Relatively Undervalued” rating from our model only indicates that this security is currently trading at a discount to its peers with similar business fundamentals. The premium/discount you see between a stock's fair value and its market price reflects the premium/discount market participants are factoring in for the management team at the target company and any unique opportunities that may exist in the industry a company belongs to. You will be able to see how this premium/discount has varied over time on our price charts. You can use this to evaluate whether you agree/disagree that the current premium/discount is justified. This is particularly important when you are looking at unprofitable companies or companies with deteriorating fundamentals. Our model may produce a Relatively Undervalued rating on some of them based on how similar companies are trading. However, that does not automatically mean these companies are a good investment. We recommend reviewing the output of our model over a handful for securities you track closely to get a feel for the information the model is conveying. Keep in mind that at the end of the day, this is a model. It is also one that is trying to normalize the notion of Relative Fair Value across a large universe of securities and it is doing that by only looking at line items in the financial reports of the companies. It is not a substitute for your due diligence and company/industry specific analysis.
Welcome to Fundamental Speculation! We hope you find this tool useful in your investment analysis process.